# Synthesize test results
> Learn how to turn raw usability test data into findings, insights, and prioritized recommendations your team will act on.
Source: https://uxspot.io/synthesize-test-results
From raw data to decisions
After a round of usability testing you are left with a pile of raw material: session notes, recordings, quotes, task timings, and half-legible scribbles. None of it is useful yet. Synthesis is the work of turning what you saw into what the team should do, and it follows a ladder with four rungs.
Observations become findings, findings become insights, and insights become recommendations. Each rung adds interpretation, so keep the rungs separate.
An observation is a single thing that happened in a session. A finding is a pattern of observations across participants. An insight explains why the pattern happens and what it means for users. A recommendation proposes what to change. When teams skip rungs, they leap from one participant's complaint straight to a redesign. Climbing the ladder deliberately keeps your conclusions honest and traceable back to evidence.
keywords
- #Synthesis
- #Observations
- #Insights
- #Recommendations
Capture clean observations
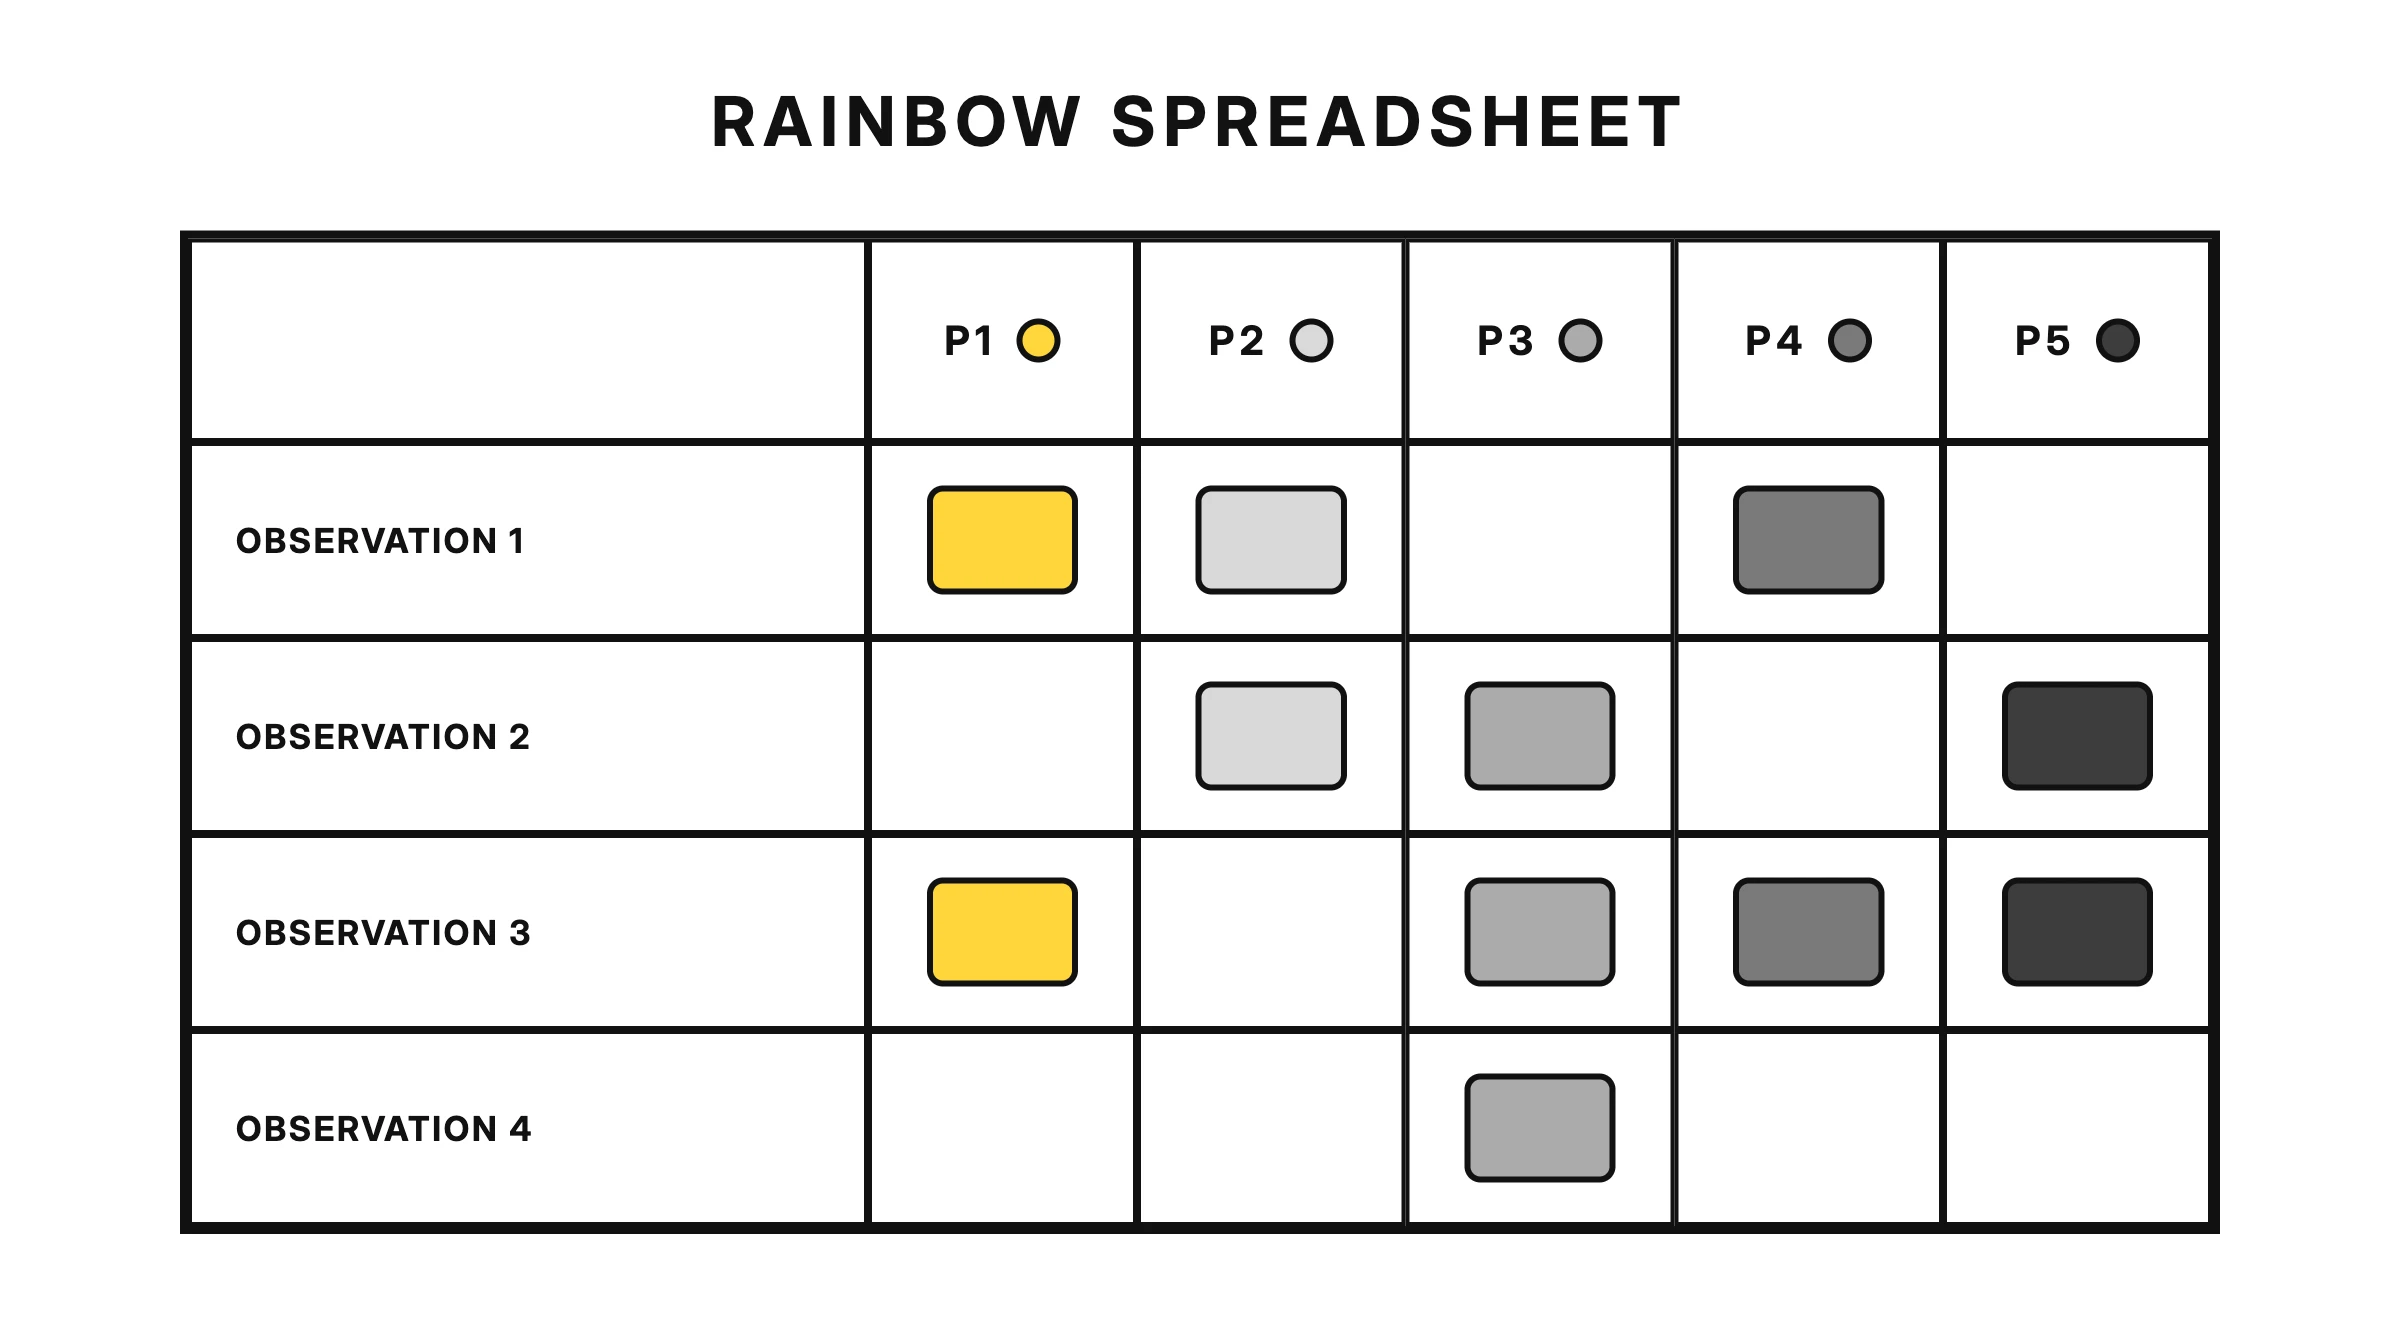
Good synthesis starts during the sessions, not after. An observation records exactly what happened: what the participant did, what they said word for word, and where in the task it occurred. Write down "tapped the back arrow three times on the payment screen," not "was frustrated" — behavior first, interpretation later.
"Was frustrated" is already a conclusion, and conclusions written mid-session tend to reflect your expectations more than the participant's reality. Maybe they were frustrated. Maybe they were exploring, or double-checking a price. Capture the raw behavior and decide later, with the full pattern in view.
Verbatim quotes are your most persuasive material. "Wait, did that add it twice?" said by a real person carries more weight in a stakeholder meeting than any summary. Keep quotes in the participant's exact words, attributed with codes like P3 rather than names to protect privacy.
One observation per note. If a participant misread a label and then abandoned the checkout, that is two notes. Atomic observations are what make the next step possible.
keywords
- #NoteTaking
- #VerbatimQuotes
- #BehaviorNotOpinion
Affinity mapping
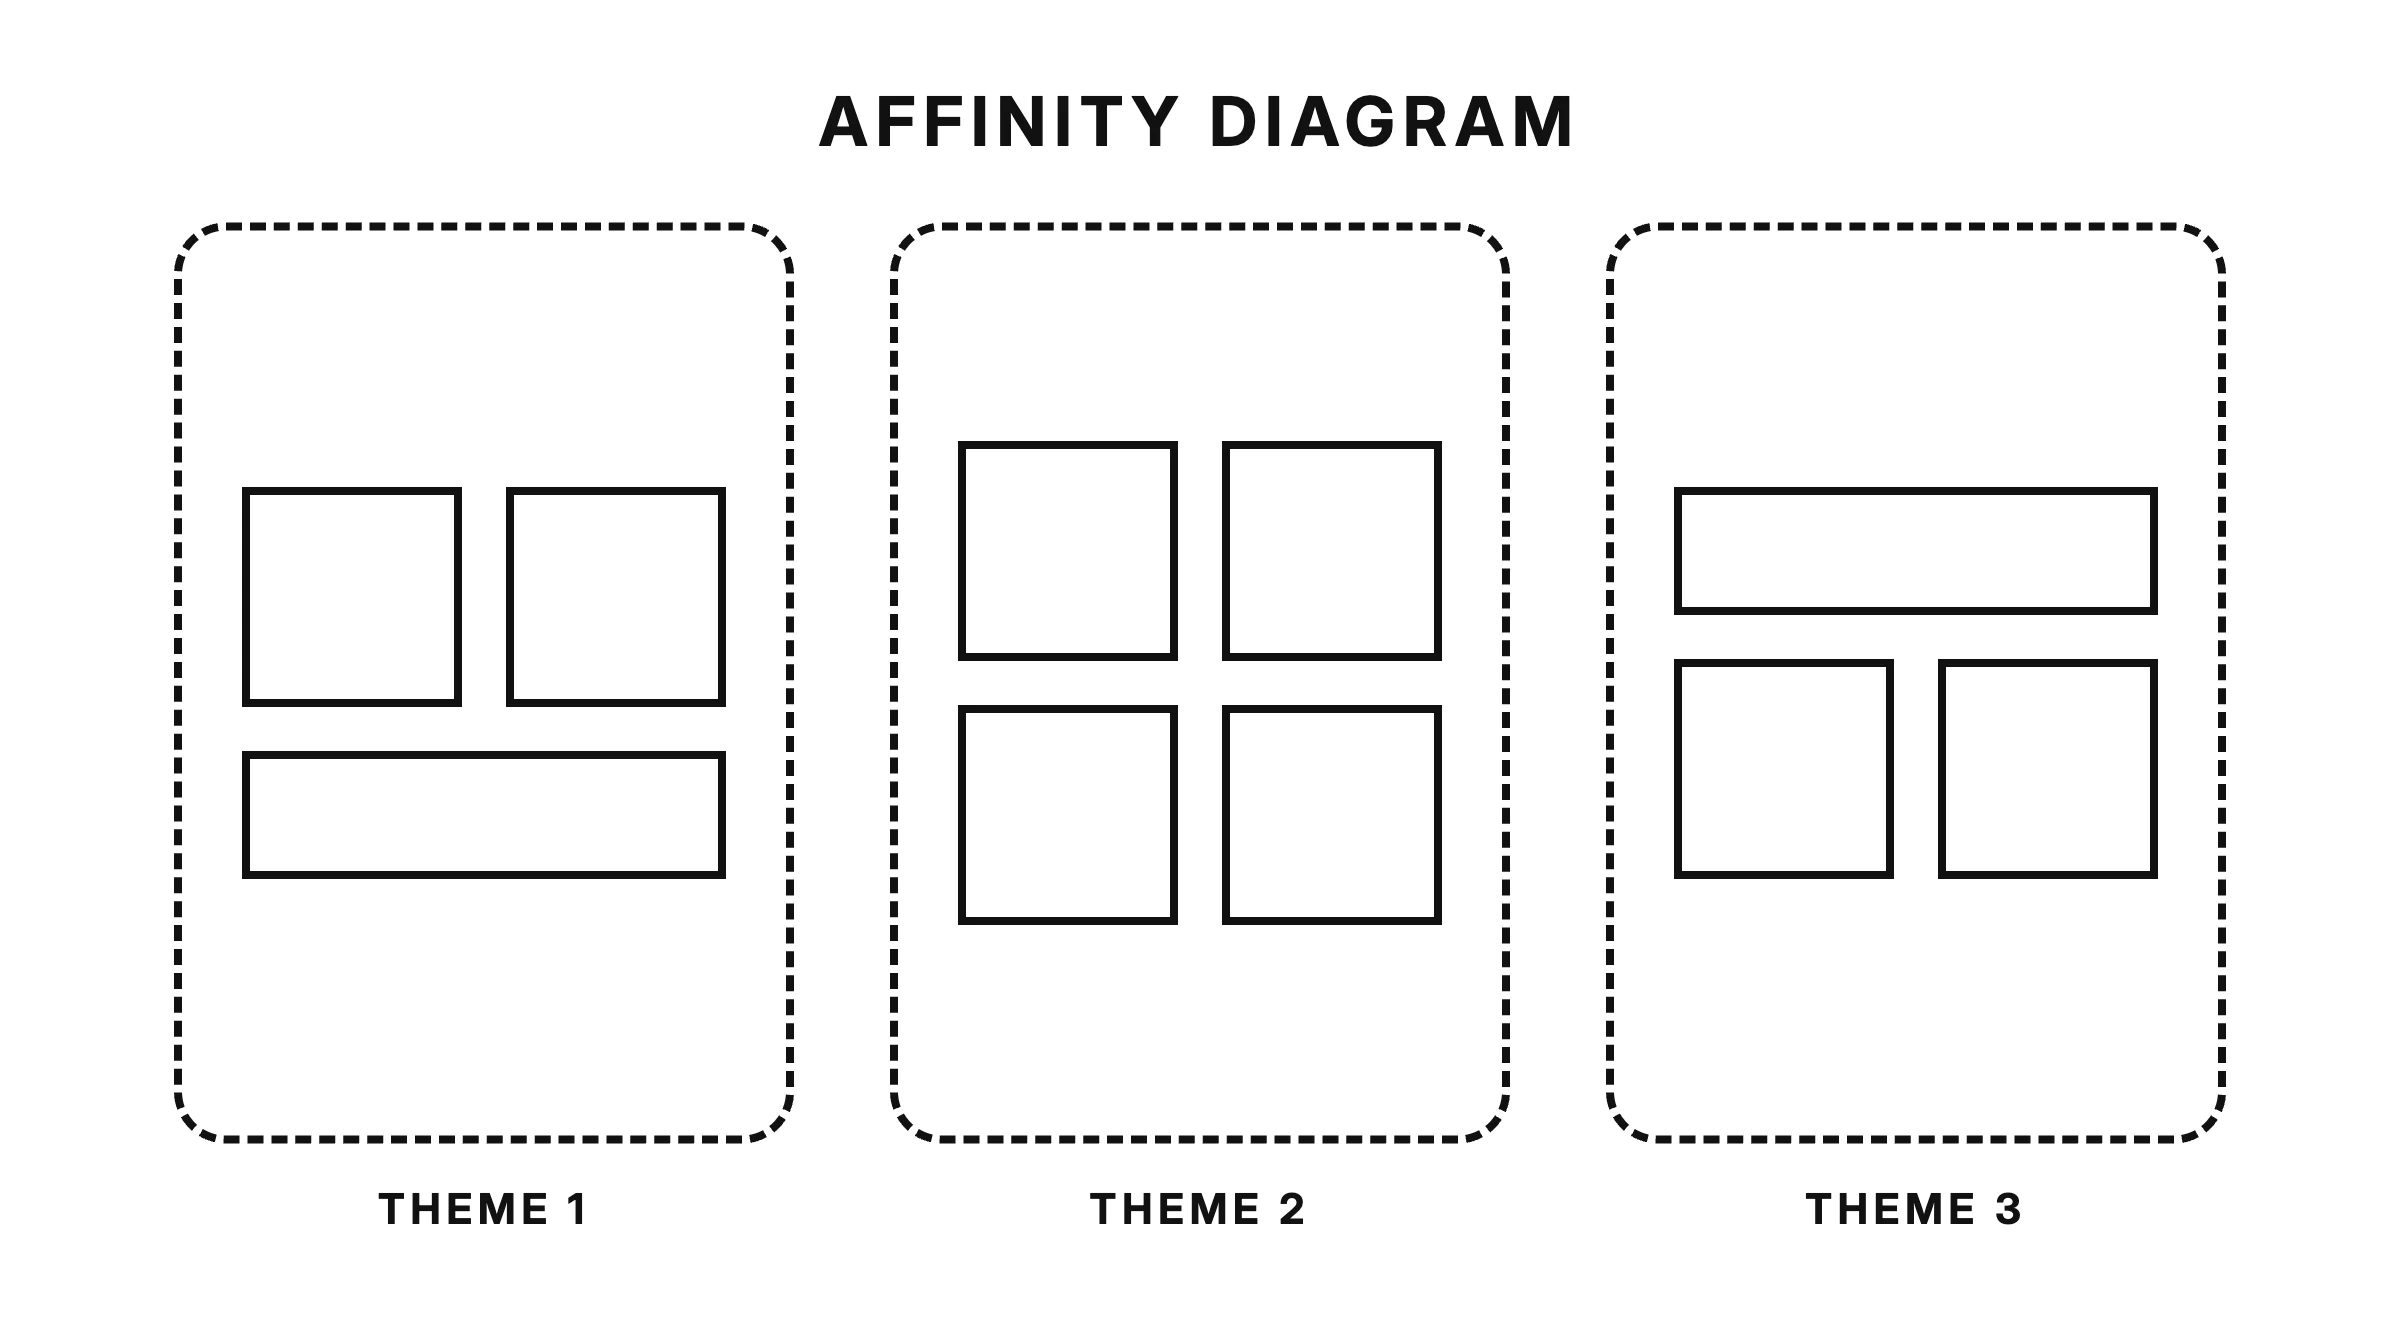
Affinity mapping is grouping individual observations by similarity so that patterns across participants become visible.
Put every observation on its own sticky note — physical or digital. Then start grouping: pick a note, find others that feel related, and place them together. When a cluster forms, give it a short descriptive label written as a sentence, such as "People don't notice the saved-address option," rather than a vague bucket like "Checkout."
Let the themes emerge from the notes instead of sorting notes into categories you decided in advance. If you start with buckets like "Navigation" and "Content," every note will find a home and you will learn nothing new. The surprising clusters — five participants doing the same odd workaround you never anticipated — are exactly what pre-made categories hide.
Map with a colleague when you can — disagreements about where a note belongs surface assumptions worth questioning. A cluster becomes a finding when it contains observations from multiple participants; one person struggling is a data point, three people struggling the same way is a pattern.
keywords
- #AffinityMapping
- #Themes
- #Patterns
From theme to insight
A theme tells you what kept happening. An insight goes further: it explains why it happened and points toward what to do about it. A useful formula: observation, plus probable cause, plus consequence for the user.
Compare the two. Theme: "Four of six participants missed the promo code field." Insight: "Participants missed the promo code field because it sits below the order summary where nobody looks at that stage, so people who came specifically for a discount believed the site did not honor it and abandoned the cart." The second version names a cause the team can act on and a consequence the business will care about.
Problems, requests, and preferences
Not everything participants say belongs on the same list. A usability problem is evidence that the design blocked or misled someone. A feature request is a participant designing on the spot — "you should add a wishlist." A preference is taste — "I'd make this blue." Log requests and preferences separately as input for product discussions, but do not let them dilute your findings. Your findings report what the design did to people, not what people would do to the design.
keywords
- #Insights
- #RootCause
- #FeatureRequests
Severity ratings
Not every finding deserves a sprint. Severity ratings let the team fix the worst problems first. A practical way to judge severity is frequency times impact: how many participants hit the problem, and how badly it hurt them when they did.
Blocker
The participant could not complete the task at all. In an e-commerce test, a payment form that rejects valid card numbers is a blocker. These get fixed before anything else ships.
Major
The task was completed, but with serious difficulty, wrong turns, or outside help. Most participants eventually found the filter menu, but only after scrolling past it twice and expressing doubt they were in the right place.
Minor
A hesitation or small irritation that slowed people down without derailing them. A confusing icon that users figured out within a few seconds usually lands here.
Cosmetic
Noticed but harmless: a misaligned label, an awkward phrase. Worth a ticket, not a meeting.
A minor issue that every participant hit can outrank a major issue that only one participant hit — rate the finding, not the moment.
keywords
- #Severity
- #Prioritization
- #FrequencyTimesImpact
Share findings people read
The best synthesis fails if it lives in a document nobody opens. Write each finding as a short, self-contained card: one insight, its severity, the evidence behind it — participant count, one or two quotes, a link to the moment in the recording — and a suggested direction. One insight per card; if the headline needs the word "and," split it.
A three-minute highlight reel of real users struggling will change more minds than a forty-page report. Clip the moments where participants hit your top findings and play them in the share-out. Watching someone tap the same dead button three times creates a kind of conviction that a bullet point never will.
Invite the team to the share-out rather than emailing a file, walk through the top findings by severity, and end with the decisions you need. Turning those decisions into design changes is the subject of the next article.
keywords
- #FindingsReport
- #HighlightReel
- #Storytelling
Takeaways
Synthesis climbs a ladder: capture behavior without interpretation, group it until patterns emerge, explain the patterns, then prioritize by frequency times impact.
Keep observations atomic and verbatim, let affinity mapping surprise you, write insights that name cause and consequence, and share the result as short evidence-linked cards and a highlight reel — not a report that dies in a shared drive.