Why measure UX at all?
What gets measured gets funded. Metrics are how design earns its seat at the table.
When you say a checkout flow "feels clunky," a product manager hears an opinion. When you say that a third of users abandon the flow on the payment step, they hear a problem worth fixing. Numbers translate design quality into the language the rest of the business already speaks, and they let you prove that your work changed something.
But be careful with the direction of that relationship. Metrics inform your judgment as a designer; they never replace it. A number can tell you that something changed, but it takes a designer to understand why it changed and what to do next. Treat metrics as evidence in an argument you are building, not as a machine that makes decisions for you.
-
keywords
- #Metrics
- #Evidence
- #DesignImpact
Study-level metrics
The four numbers from a usability study
You have already met the metrics that come out of a single usability study, so here is a quick recap. Task success tells you whether participants completed a task at all, for example how many of eight testers managed to reschedule a booking. Time on task measures how long completion took. Error rate counts the wrong turns: taps on the wrong button, form fields filled incorrectly, dead ends reached. Subjective ratings capture how the experience felt, usually through a short questionnaire after the session.
These four are powerful inside a study, but they describe a handful of people performing scripted tasks. To understand how a live product with thousands of real users is doing, you need a second layer of measurement.
-
keywords
- #TaskSuccess
- #TimeOnTask
- #ErrorRate
- #SubjectiveRatings
Product-level signals
Product-level metrics come from the behavior of your entire user base over time. Two frameworks help you choose which ones matter.
The HEART framework
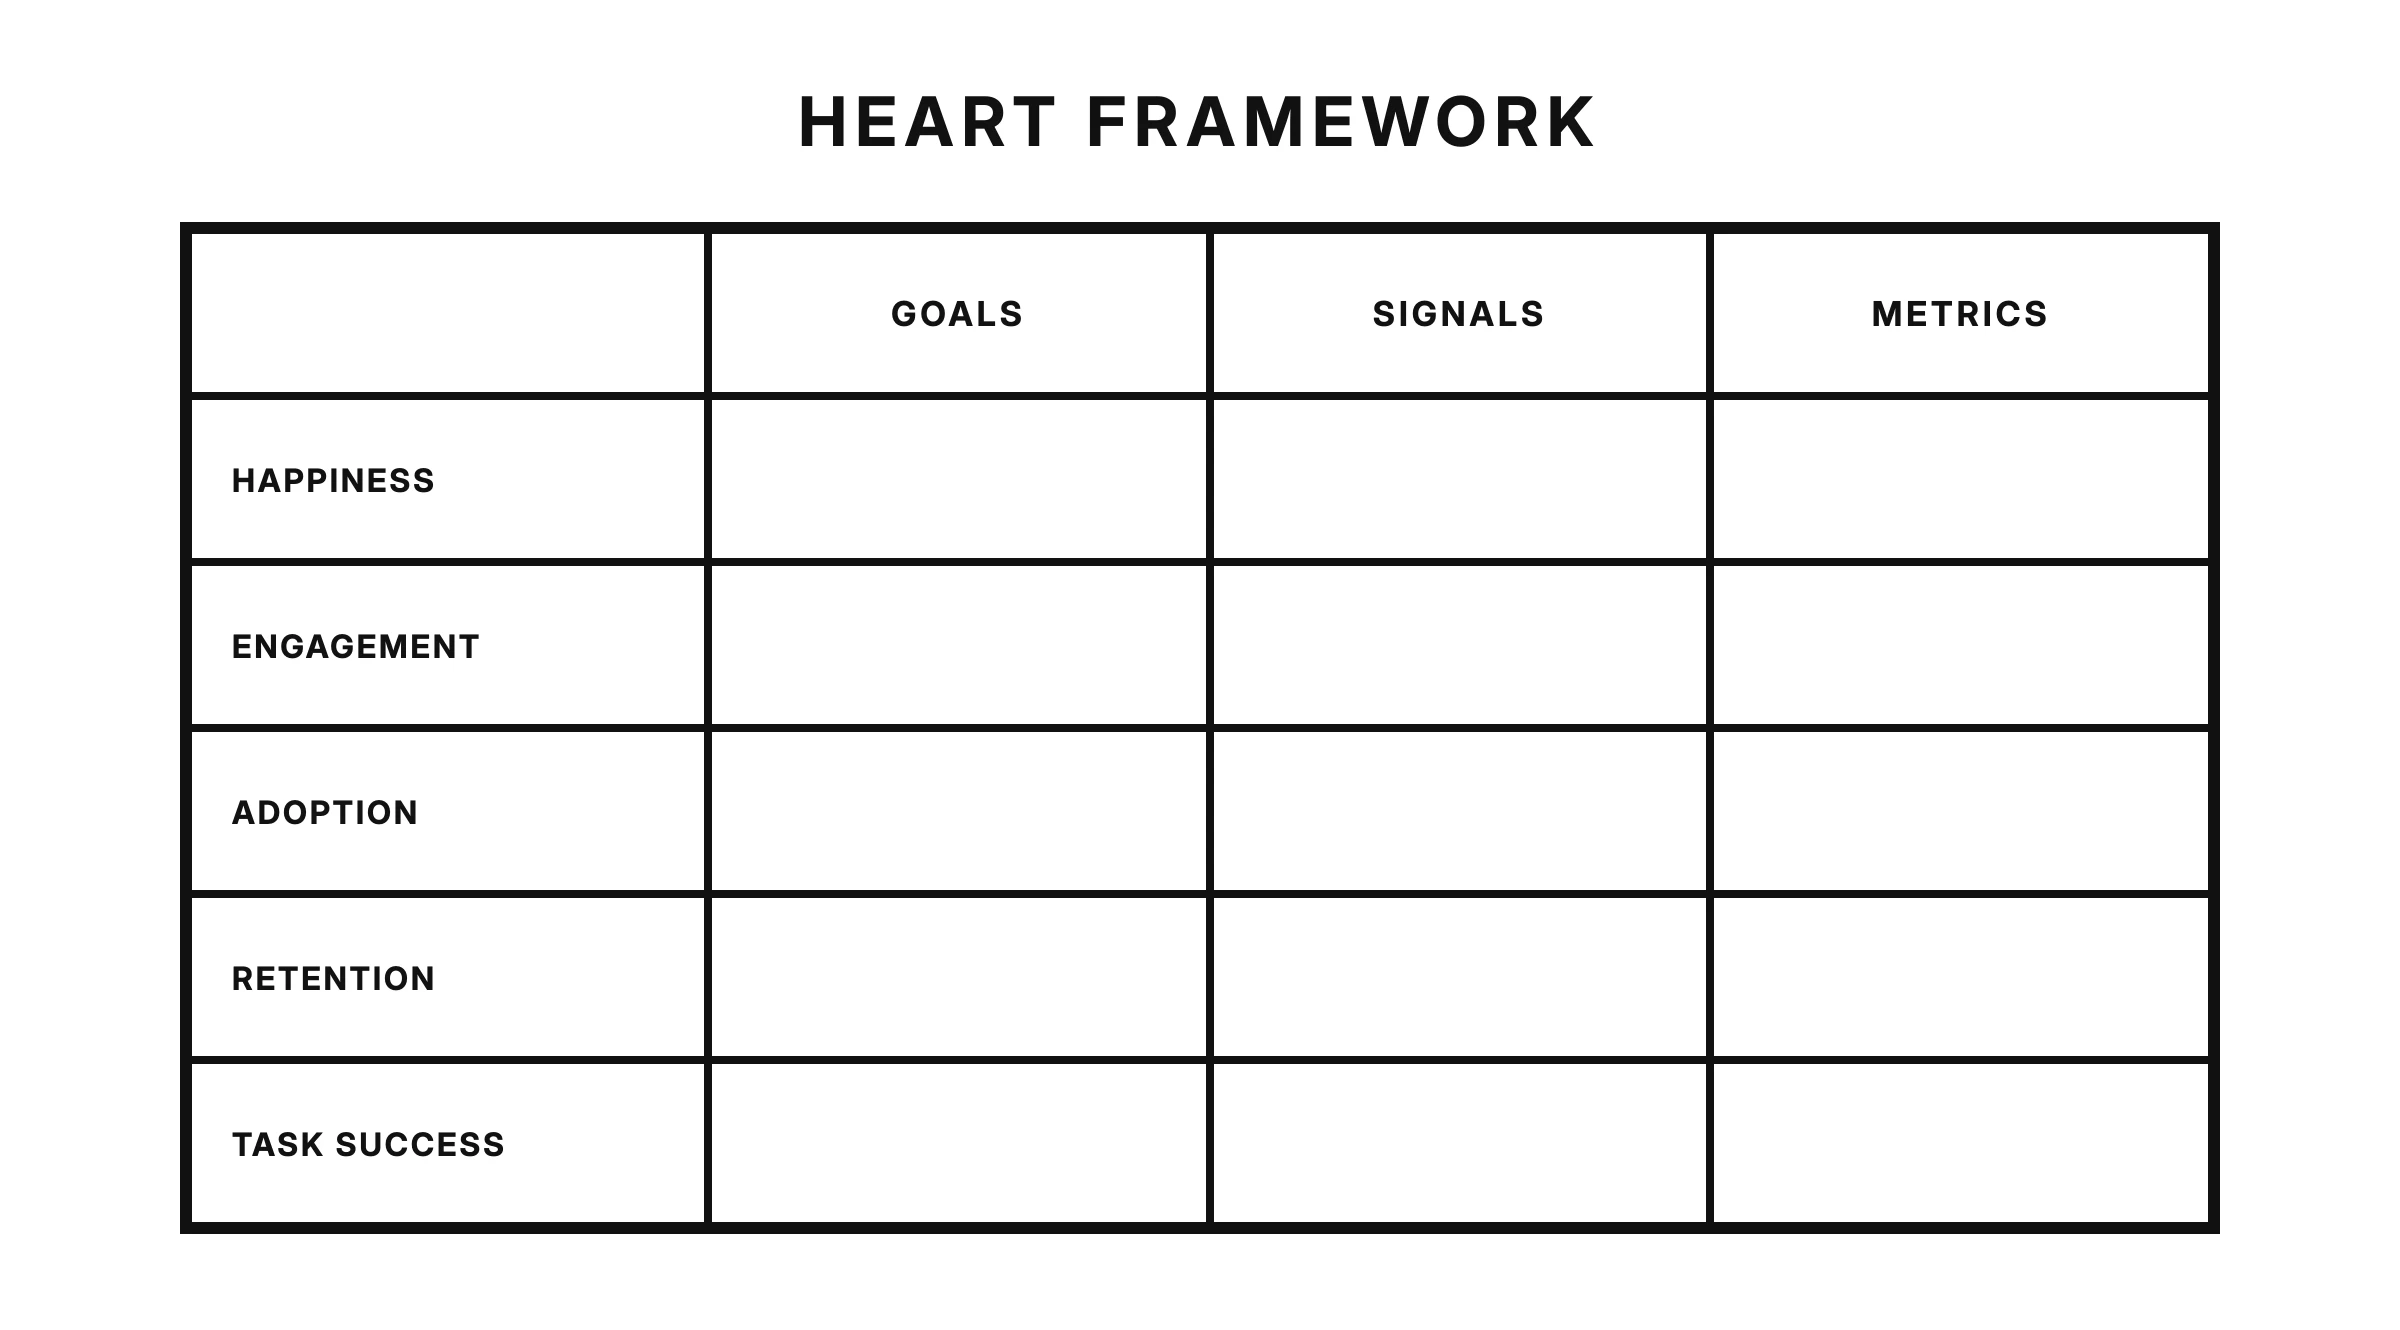
HEART, developed by Google's research team, organizes UX measurement into five categories: Happiness, Engagement, Adoption, Retention, and Task success.
Happiness covers how users feel about the product, measured through surveys and ratings. A note-taking app might track the score users give when asked how satisfied they are after a month of use.
Engagement captures how deeply and how often people use the product. For a music app, that could be the number of playlists an average listener creates per week.
Adoption measures how many new users start using the product or a specific feature. If you ship a dark theme, adoption is the share of users who turn it on within the first month.
Retention tracks whether users come back. A meal-planning app might measure how many of the people who signed up in January are still planning meals in March.
Task success at product scale means completion of key journeys in the live product, such as the percentage of started checkouts that end in a confirmed order.
You rarely need all five HEART categories at once. Pick the two or three that match what your team is trying to improve right now.
From goals to signals to metrics
A framework only tells you what categories exist. To get from a vague ambition to an actual number, walk the goals-signals-metrics ladder. Start with a goal stated in human terms: "we want onboarding to feel effortless." Then identify signals, the observable behaviors that would indicate the goal is met or missed: people finish setup without visiting the help page, and they do not abandon halfway. Finally, turn each signal into a metric you can track: the percentage of new users who complete setup within their first session, and the share of setup sessions that include a help-page visit.
A good metric is just a goal that has been forced to be specific. If you cannot trace a metric back to a goal your users would recognize, question why you are tracking it.
-
keywords
- #HEART
- #GoalsSignalsMetrics
- #ProductSignals
North Star thinking
Teams drown when everyone optimizes a different number. A North Star metric is the single measure the whole team agrees best captures the value users get from the product. For a messaging app it might be conversations held per week; for a booking platform, completed stays. When designers, engineers, and marketers all orient on the same star, debates about priorities get shorter.
A North Star needs guardrail metrics: numbers you watch to make sure you are not improving the star by damaging something else. If your star is completed bookings, guardrails might be cancellation rate and support contacts per booking. A North Star without guardrails invites you to win the metric while losing the user.
-
keywords
- #NorthStar
- #Guardrails
- #Alignment
Connecting design to business outcomes
Here is what the connection looks like in practice. Imagine you redesign the settings area of a subscription product because usability sessions showed people could not find how to update their payment card. You state the goal, pick your signals, and record the numbers before you ship: how many support tickets mention payment updates, and how many trial users activate a paid plan.
After launch, you check again. Tickets about payment updates drop, because people now find the option themselves. Activation rises, because a stalled card update was quietly blocking upgrades. Now your design review is not "the new settings look cleaner" but "the redesign reduced a support cost and removed a barrier to revenue."
Always capture the before-numbers ahead of shipping; a result with no baseline is just an anecdote.
-
keywords
- #Baseline
- #SupportTickets
- #Activation
Metric traps
Measurement has failure modes, and designers should know them by name.
Vanity metrics. Numbers that only go up, like total registered accounts or cumulative downloads, flatter the team but say nothing about whether anyone is getting value. Prefer metrics that can go down when the experience gets worse.
Engagement that means confusion. Time in the product cuts both ways. A user spending ten minutes in your banking app might be happily reviewing budgets, or hopelessly lost looking for the transfer button. Time on task has the same double edge inside studies: longer can mean engaged, or stuck. Pair any duration metric with a success or satisfaction measure before you celebrate it.
Gaming the number. When a metric becomes the target, people optimize the metric instead of the experience. Moving the sign-up button onto every screen will lift sign-up clicks without making the product any better. The industry's cautionary tale is deceptive patterns: entire interfaces bent toward a conversion number at the direct expense of the user's trust.
-
keywords
- #VanityMetrics
- #GoodhartsLaw
- #DoubleEdged
A designer's minimal dashboard
You do not need forty charts. You need a handful of numbers you actually check.
A practical starting set: one task success metric for the journey you are currently working on, one happiness measure such as a recurring satisfaction score, one retention number to confirm people keep coming back, and one guardrail such as support contact volume. Review them at a steady rhythm, before and after every release that touches the experience.
Keep it small on purpose. A dashboard you scan weekly beats a warehouse of data nobody opens, and each number should map back to a goal you could explain to a user in one sentence.
-
keywords
- #Dashboard
- #Focus
- #Rhythm